How to Measure Social Media ROI for E-Commerce Growth
Measuring your social media ROI really boils down to a simple formula: (Revenue - Cost) / Cost x 100. The real work, though, isn’t in the math. It's in accurately tracking the revenue and costs tied to your social media, and that means you need a rock-solid attribution system.
The goal is to scale without dubious shortcuts and without hurting your credibility.
Why Measuring Social Media ROI Is a Game Changer
Feeling the heat to justify your social media budget? You're not the only one. Countless e-commerce teams struggle to draw a straight line from their social media activity to the bottom line. It’s so easy to get caught up chasing vanity metrics—likes, shares, follower counts—that look impressive on paper but don't actually explain how your Instagram stories or TikTok ads are ringing the register.
This guide is designed to cut through that noise. We’re going to demystify social media ROI for e-commerce and show you exactly how to connect every post, ad, and campaign to tangible business results. This isn't just generic advice; it's a practical framework for DTC brands and Shopify store owners who need to know what's working and what’s just wasting money.
From Vanity Metrics to Tangible Value
Look, the ROI formula itself is easy. The tough part is correctly attributing revenue back to specific social campaigns. It's no surprise that 61% of marketers say measuring ROI is their single biggest challenge.
Think about the modern customer journey. A shopper might see your ad on TikTok, get a retargeting post on Facebook a few days later, and then finally click a link in your newsletter to buy. Which channel gets the credit? That’s the puzzle we’re here to solve.
The goal is to turn your social media data from a confusing jumble of spreadsheets into a powerful engine for strategic growth. It’s about making confident, data-backed decisions instead of just guessing what your audience wants.
The Real Impact on Your Business
Once you get a handle on your social media ROI, you can do a lot more than just fill out a report. It gives you the power to:
- Allocate Budgets Wisely: Double down on the channels and campaigns that are actually making you money and pull back from the ones that aren't.
- Optimize Your Strategy: Pinpoint which content formats, messages, and platforms genuinely connect with your customers and convince them to buy.
- Prove Your Value: Show stakeholders, in no uncertain terms, how the social media team is a direct contributor to the company's financial success.
To truly stop guessing and start quantifying your impact, you need a solid grasp of how to measure marketing ROI in a broader sense. It sets the stage for your social-specific calculations, making sure every dollar you spend is accounted for and working toward real growth. Let's get started building a system that finally connects your social media efforts to sales.
Start With Your Business Goals, Not Social Media Metrics
Before we even think about calculating ROI, we need to be crystal clear on what "return" actually means for your business. It's so easy to get caught up chasing likes, shares, and follower counts, but without a direct line to real business outcomes, those are just vanity metrics. It’s like being busy without being productive.
The very first step is to forget about social media for a minute and ask: What does my e-commerce store really need to achieve right now? Are we trying to bring in more first-time buyers? Do we need to increase the average order value? Or is the big push to get existing customers to come back and buy again?
Your answer to that question is the foundation of your entire measurement strategy.
From Business Needs to Social KPIs
Let’s make this tangible. Imagine you run an e-commerce store on Shopify selling premium, sustainable coffee beans. Your main business objective for the quarter isn't just about acquiring new customers at any cost. Instead, you want to increase profit margins by boosting customer loyalty.
With that goal in mind, your key performance indicators (KPIs) on social media suddenly look very different. You're not obsessing over "reach" or "impressions." You’re focused on metrics that prove long-term value.
- The Real Goal: Increase our repeat purchase rate by 20% in Q3.
- The Social Media KPI: Customer Lifetime Value (LTV) from customers who came from our social channels.
- The Supporting Metrics: We’ll track website clicks from our Instagram "Subscribers" content, the conversion rate from our email list sign-ups (which we get via a social media lead magnet), and even engagement within our private Facebook group for coffee lovers.
See how that flips the script? You stop posting content and just hoping for the best. Instead, you're building specific social campaigns designed to nurture the customers you already have and give them a reason to come back.
When you tie your social media activities to a core business objective like LTV, you graduate from vanity metrics. Social media becomes a powerful engine for customer retention, not just a noisy channel at the top of the funnel.
To really nail this down, it’s critical to link social media ROI to marketing goals. This discipline ensures every post, story, and ad has a purpose that you can actually measure against the bottom line.
Matching Goals with the Right Metrics
Of course, not every business has the same priorities. A dropshipper who’s trying to scale as fast as possible will have a completely different set of KPIs than our coffee bean brand. Their entire world might revolve around acquiring customers as cheaply as possible.
- Their Business Goal: Achieve rapid market penetration and scale sales volume.
- Their Social Media KPI: Customer Acquisition Cost (CAC) from their TikTok ads.
- Their Supporting Metrics: They'll live and die by their Conversion Rate (CVR), Click-Through Rate (CTR) on ads, and Return on Ad Spend (ROAS).
For this business, a post getting tons of likes is completely irrelevant if it doesn’t lead to a cost-effective sale. Their success is purely a numbers game: keep CAC low and conversions high.
To help you build your own blueprint, I’ve put together a table that maps common e-commerce goals to the social media KPIs that actually matter.
Mapping E-Commerce Goals to Social Media KPIs
This table will help you connect the dots between what you're trying to achieve as a business and what you should be measuring on social media.
| E-Commerce Business Goal | Primary Social Media KPI | Secondary Social Media Metrics | Example Scenario |
|---|---|---|---|
| Increase Brand Awareness | Reach & Impressions | Follower Growth, Video Views | A new DTC skincare brand launching its first product line. |
| Boost Sales Revenue | Conversion Rate | Add to Carts, Revenue per Visitor | A fashion store running a flash sale promoted via Instagram Stories. |
| Improve Profitability | Customer Lifetime Value (LTV) | Repeat Purchase Rate, Churn Rate | A subscription box service using social media to reduce cancellations. |
| Acquire New Customers | Customer Acquisition Cost (CAC) | Cost Per Click (CPC), Leads | A gadget store using Facebook ads to find new buyers for a viral product. |
Think of this as your starting point. Pick the business goal that matters most right now, and let that dictate the metrics you obsess over on social.
Build Your E-Commerce Tracking and Attribution System
Once you’ve locked in your business goals, it’s time to get your hands dirty with the technical setup. This is the foundation for measuring your social media ROI accurately. Think of it as building the plumbing for your data—without a solid tracking and attribution system, you're essentially flying blind, just guessing where your sales are coming from.
The objective here is to create a rock-solid data pipeline that connects every single social media interaction to a real outcome on your store. We're not just plugging in a few tools; we're architecting a resilient system that maps the entire customer journey, from that first click on a TikTok ad all the way to the final purchase confirmation.
This whole process can be boiled down into a simple flow: a clear business goal informs your social KPIs, which then lets you calculate the financial return.
Let's dive into exactly how to build this system.
Establish a Consistent UTM Convention
First things first: Urchin Tracking Module (UTM) parameters. These are simple tags you tack onto the end of your URLs, and they are non-negotiable. They tell analytics platforms like Google Analytics exactly where your traffic originated. Without them, all your social traffic gets dumped into one generic, unhelpful bucket.
A good UTM convention is like a digital filing system for your traffic. It’s what allows you to see the difference between a click from an Instagram Story ad and one from a link in your private Facebook group.
Here’s a practical framework I always recommend:
- utm_source: The platform itself (e.g.,
facebook,instagram,tiktok). - utm_medium: The marketing channel type (e.g.,
social,cpc,influencer). - utm_campaign: The specific campaign you’re running (e.g.,
spring-sale-2024,new-product-launch). - utm_content: Use this to distinguish between ads or links in the same campaign (e.g.,
video-ad-1,carousel-post).
Consistency is everything. Create a simple shared spreadsheet where your team can build and log these links. This small bit of discipline will pay off massively when it's time to analyze your performance.
Implement Pixels and Server-Side Tracking
While UTMs track the click, tracking pixels monitor the action. These are little snippets of code, like the Meta Pixel or TikTok Pixel, that you place on your website. They fire when users perform key actions like ViewContent, AddToCart, and, most importantly, Purchase. They're the engine behind retargeting and ad optimization.
But let's be real: browser-based pixels are not as reliable as they used to be. Between iOS privacy updates and ad blockers, a lot of data gets lost. This is where server-side tracking saves the day.
Instead of relying on the user's browser to fire off conversion data, server-side tracking (like Meta's Conversions API) sends that data directly from your e-commerce store's server to the ad platform. It's a more accurate and durable method that bypasses most of the data-loss issues plaguing old-school pixels.
For any serious e-commerce brand today, setting this up isn't optional. It ensures your data is as complete as possible, leading to smarter ad optimization and a much more accurate ROI figure.
Choose an Attribution Model That Fits Your Business
Attribution is simply the process of assigning credit for a sale. A customer might see your ad on Instagram, click a link on Pinterest a week later, and finally buy after seeing a Facebook ad. So, which channel gets the credit? An attribution model is the set of rules you use to make that call.
There are several models out there, and each one tells a different story about the customer journey:
Last-Touch Attribution: This is the default for most platforms and the simplest to understand. It gives 100% of the credit to the very last touchpoint before the conversion. It’s easy to measure but often misses the bigger picture.
First-Touch Attribution: The complete opposite. This model gives 100% of the credit to the very first touchpoint that introduced a customer to your brand. It's great for figuring out which channels are driving top-of-funnel awareness.
Multi-Touch Attribution (e.g., Linear, Time-Decay): These are more sophisticated models that spread the credit across multiple touchpoints. A linear model gives equal credit to every interaction, while a time-decay model gives more weight to the touchpoints closer to the sale.
For most e-commerce brands, starting with a last-touch model is perfectly fine. But as you grow, exploring the multi-touch models available in Google Analytics 4 can unlock some incredible insights into how your social channels work together. The most important thing is to pick one model and stick with it for consistent performance evaluation.
Running the Numbers: Your Key E-Commerce Growth Metrics
Alright, you've set your goals and your tracking is in place and collecting data. Now for the fun part—actually running the numbers. This is where we turn the fuzzy idea of "social media ROI" into a hard figure you can take to your next team meeting.
We're going to focus on the three metrics that truly matter for any growing e-commerce brand: Return on Investment (ROI), Customer Acquisition Cost (CAC), and Customer Lifetime Value (LTV).
To make this real, let's work through a scenario. Picture yourself running a Shopify store that sells artisanal hot sauce. You just wrapped up a month-long ad campaign on Facebook.
Calculating Your Real Campaign ROI
First things first, let's get your true ROI. A common pitfall I see all the time is brands only looking at ad spend. To get a real picture of profitability, you have to account for every single dollar that went into the campaign.
Let's add up the total investment for your hot sauce promotion:
- Ad Spend: The direct cost for your Facebook ads was $2,000.
- Content Creation: You hired a freelancer to shoot and edit some video ads, which cost $500.
- Tools & Software: You need to attribute a portion of your social media scheduling tool's subscription. Let's say that comes out to $50 for this campaign.
- Team Time: Your social media manager spent about 10 hours managing the campaign. At an internal rate of $40/hour, that's $400 in human resources.
So, your Total Investment wasn't just the ad spend; it was $2,950.
Thanks to your UTMs and the Meta Pixel, you know the campaign brought in $9,500 in revenue.
Now, we just plug those numbers into the classic ROI formula:
ROI = ((Revenue - Investment) / Investment) x 100
ROI = (($9,500 - $2,950) / $2,950) x 100 = 222%
A 222% ROI is a fantastic result. It means that for every single dollar you put in, you got back $2.22 in profit after covering all your costs. That’s a number you can build a strategy around.
Nailing Down Your Customer Acquisition Cost
Next up is CAC. How much are you actually paying to get a new customer through the door?
Let’s say you also worked with an influencer on Instagram. You paid them a $1,000 fee and sent them $100 worth of hot sauce. The total cost here is $1,100.
The influencer shared a unique discount code, and you can see it was used by 55 new customers.
The math for CAC is simple:
CAC = Total Campaign Cost / Number of New Customers Acquired
CAC = $1,100 / 55 = $20
Your Customer Acquisition Cost for that influencer campaign was $20. This figure is crucial. If your average order value is $45 with a 50% profit margin ($22.50 profit), a $20 CAC means you were profitable on the very first purchase. That's a win.
Understanding the Long-Term Value (LTV)
The final, and arguably most important, piece of the puzzle is LTV. This is where you prove that social media isn't just about one-off sales; it's about building a loyal customer base. Are the customers you find on social channels sticking around?
To figure this out, you'll need to jump into your customer data and segment everyone you've acquired from social media over the past year.
Let’s say you dig in and find:
- Their Average Order Value (AOV) is $50.
- They make about 3 purchases per year.
- On average, they remain a customer for 2 years.
Now, let's calculate their LTV:
LTV = AOV x Average Purchase Frequency x Average Customer Lifespan
LTV = $50 x 3 x 2 = $300
This $300 LTV is the number that should get everyone excited. When you put it next to your $20 CAC from that influencer campaign, you have an incredible 15:1 LTV:CAC ratio. This is powerful evidence that your social efforts are acquiring highly valuable, long-term fans of your brand.
This experience isn't unusual. In fact, 2023 data shows that 28% of global marketers point to Facebook as the platform delivering the highest ROI. But that stat doesn't tell the whole story—a full 50% of marketers admit they struggle to even measure ROI effectively. It underscores why looking at the full picture, including long-term value, is so critical. For a deeper dive into these figures, you can explore more social media ROI statistics.
Create Actionable Reports That Drive Decisions
All the raw data in the world is useless until you turn it into a story that inspires action. Having your ROI, CAC, and LTV numbers is a fantastic start, but just listing them in an email won’t convince your leadership team or help you craft a winning strategy. The final, critical piece of the puzzle is transforming those numbers into compelling, actionable insights.
The goal here is to move past data-dumping. An effective report doesn't just show what happened; it explains why it happened and clearly outlines what to do next. This is how you prove the real value of your social media investment and start driving smarter marketing decisions across the whole company.
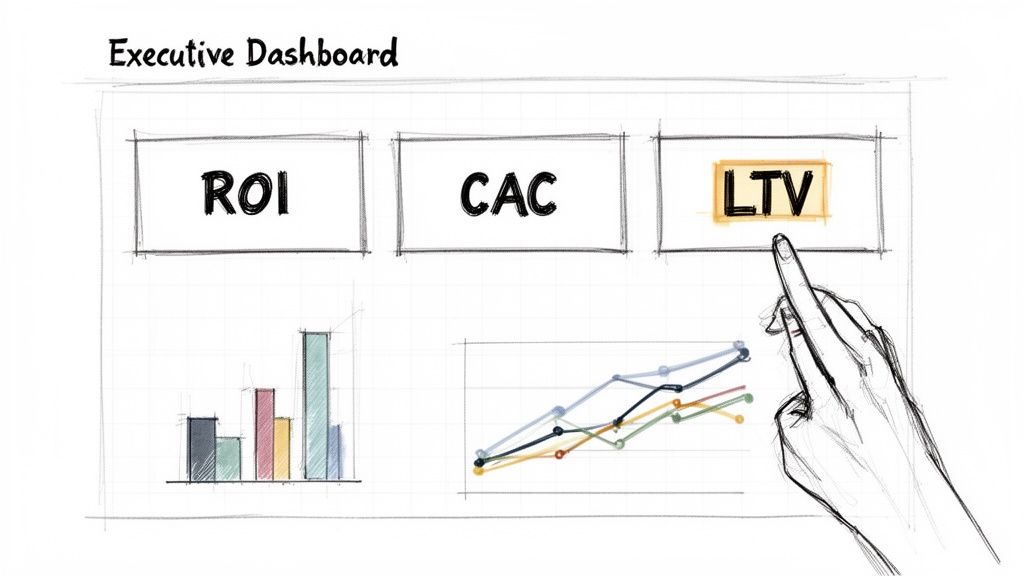
Building Your Social Media ROI Dashboard
First things first: build a simple, powerful dashboard. I'm not talking about some overly complex, multi-tabbed beast. This is about visualizing the handful of metrics that matter most to the business. You can get this done easily with accessible tools like Google Looker Studio, which lets you pull data from Google Analytics and your spreadsheets into one clean, shareable view.
Think of your dashboard as a high-level snapshot focused squarely on business outcomes. A few key visuals will do the trick:
- Overall Social Media ROI: A big, can't-miss-it number showing your blended ROI percentage across all channels.
- CAC vs. LTV Trends: A line chart comparing Customer Acquisition Cost against Customer Lifetime Value. This is the ultimate health check—it instantly tells you if your customer acquisition is profitable over the long term.
- Revenue by Social Channel: A simple bar chart breaking down which platforms—Facebook, Instagram, TikTok—are actually driving sales.
- Conversion Rate by Channel: A small table showing the conversion rate for traffic from each social source. This helps you spot your most efficient channels.
This kind of dashboard gives anyone an at-a-glance understanding of your social media performance, making it dead simple to grasp the financial impact of your work.
A great dashboard tells a story in seconds. If a stakeholder can't understand the key takeaways within 30 seconds of looking at it, it’s too complicated. Focus on clarity and business impact above all else.
It's also worth noting that new tech is making this even easier. The adoption of AI and advanced measurement tools is really changing the game for e-commerce. Recent data shows that among companies using AI-powered social selling tools, 39% saw moderate ROI increases, while 29% saw significant growth. These tools are helping solve the classic measurement headache, a topic explored in more detail in these social media marketing statistics.
Structuring Your Monthly ROI Report
While the dashboard is perfect for a quick check-in, the monthly report provides the narrative and strategic direction. It’s the "why" behind the "what" on your dashboard. A solid report should flow from a high-level summary to granular details, and always end with a clear plan of attack.
I've found this simple structure works wonders:
- The Executive Summary: Lead with the bottom line. In just two or three sentences, state the overall social media ROI for the month and call out the biggest win and most important learning.
- Performance Against Goals: Circle back to the KPIs you set at the beginning. Did you hit your target CAC? How's the LTV looking? A simple "Goal vs. Actual" table is incredibly powerful here.
- Channel-Specific Breakdowns: Dedicate a small section to each of your main channels. For Facebook, Instagram, etc., show the ROI, call out the top-performing content or ad, and add any quick observations.
- Key Wins & Learnings: This is the story section. What worked exceptionally well? What was a surprising flop? Frame every learning as a strategic insight for the future.
- Actionable Recommendations: Based on everything you just shared, what should the team do next month? Be specific. For instance, "We will shift 15% of the Facebook budget to Instagram Reels ads, as they generated a 45% higher ROI this month."
Following this structure turns your reports from historical documents into strategic roadmaps. They become the blueprint for getting better every single month, making your data a true engine for business growth.
Common Questions About Measuring Social Media ROI
Even with a solid framework, you're going to hit some tricky, real-world questions when measuring social media ROI. It’s one thing to know the formulas, but it’s another thing entirely to apply them when your data feels messy or incomplete. Let's dig into some of the most common hurdles e-commerce operators face.
Think of this as your troubleshooting guide. These are the practical snags that come up the minute you start taking measurement seriously. Knowing how to handle them will make all the difference.
How Do I Measure ROI From Organic Social Media Content?
This is the million-dollar question, isn't it? While it's definitely tougher than tracking a paid ad, figuring out your organic ROI is far from impossible. It just requires you to get a little creative and connect the dots in a few different ways.
You're not going to get perfect, one-to-one attribution here, but you can build a really strong directional case for its value. The whole game is about creating trackable pathways wherever you can.
Here are a few methods that actually work:
- Use Exclusive Discount Codes: This is a classic for a reason. Create a unique code that you only share in your organic Instagram posts or TikTok videos, like "INSTA15". When you tally the sales from that code, you have a direct revenue figure to attribute to your organic efforts.
- Leverage UTM-Tagged Links: Your link-in-bio is prime real estate. Make sure any link there is tagged with specific UTM parameters (e.g.,
utm_source=instagram&utm_medium=organic-bio). This carves out a specific traffic segment in Google Analytics 4, letting you see its direct conversion rate. - Check Assisted Conversions: Dive into your GA4 reports. The "Assisted conversions" report shows how often organic social channels pop up in a customer's journey before the final purchase. This is your proof that organic is warming up leads, even if it wasn't the last click.
This blended approach gives you a much more defensible way to estimate the return on your time and creative energy.
What Is a Good Social Media ROI for an E-commerce Business?
Everyone wants a magic number, but the honest answer is there's no universal "good" ROI. It really depends on your business, especially your profit margins. A 200% ROI might be amazing for one brand but completely unprofitable for another with razor-thin margins.
That said, a common benchmark for e-commerce brands is a 3:1 to 5:1 return on ad spend (ROAS), which works out to a 200% to 400% ROI. For example, spending $1 to make $4 in revenue is a 300% ROI.
The most important benchmark isn’t some industry average; it’s your own break-even point. You absolutely must calculate the ROI needed to cover your cost of goods sold (COGS), shipping, and overhead. Anything above that number is profit, making your campaigns a success for your business.
My Social Engagement Is High but ROI Is Low. What Should I Do?
This is a classic—and super frustrating—scenario. It points to a clear disconnect between your audience and your offer. High engagement is a great sign that your content is resonating, but if it doesn't lead to sales, it's time to find the gap between the likes and the purchases.
First, dig into your audience data. Are the people loving your funny reels the same people who are your ideal customers? Use your platform’s native analytics to check the demographics of your engaged followers against your target customer profile. You might be entertaining the wrong crowd.
Second, do a serious review of your calls-to-action (CTAs). Are they clear? Compelling? Easy to act on? Make sure your landing pages are fully optimized and perfectly match the promise you made in the social post. Any friction or mismatch here will absolutely tank your conversion rate.
Finally, test different content pillars. Your audience might love your memes, but maybe they only convert from posts that highlight product benefits, showcase user-generated content, or tell a compelling brand story. You have to A/B test your creative and messaging to find what actually moves the needle.
How Do I Account for Influencer Marketing Costs in My ROI Calculation?
It's simple: treat influencer marketing costs just like any other campaign expense. The "Investment" part of your ROI formula needs to include everything to be accurate.
Be sure to tally up:
- The influencer's direct fee.
- The retail cost of any products you seeded (sent for free).
- Any agency or platform fees involved in the partnership.
- Subscriptions to any tools you used for campaign management.
For the "Revenue" side, providing each influencer with a unique affiliate link or a personalized discount code is non-negotiable. It's the only reliable way to attribute sales directly to their efforts. When the campaign wraps up, just sum the total revenue from their link or code, subtract your total investment, and calculate your ROI like you would for any other channel.
Ready to stop juggling dozens of expensive tools and start driving real growth? EcomEfficiency bundles over 50+ premium AI, SEO, and ad-spy tools into one simple subscription. Discover winning products, analyze competitors, and create high-converting ad creative—all while cutting your software costs by up to 99%. Join over 1,000+ e-commerce operators and get started for just $19.99/mo.