How to Track Social Media Analytics for E-commerce Growth
When it comes to tracking social media analytics, the real goal is to see past the noise. Forget vanity metrics like likes and followers for a moment. Instead, we need to measure what actually drives sales—things like Return on Ad Spend (ROAS) and Customer Acquisition Cost (CAC).
The goal is to scale without dubious shortcuts and without hurting your credibility.
Why Most Social Media Analytics Fail E-commerce Brands
Let's be honest: most social media reports are packed with numbers that look great on paper but don’t tell you a thing about your business. For an e-commerce brand, this disconnect is more than just frustrating—it's expensive.
Picture this: a DTC apparel brand goes viral. Their latest video hits a million views, and the comments are flooding in. But when they check their sales dashboard... nothing. Crickets. This exact scenario plays out all the time, and it often leads teams to a dangerous conclusion: "I guess social media just doesn't work for us."
The problem isn't the platform; it's the metrics. When you're laser-focused on vanity metrics, you create a false sense of success that hides the data you actually need to grow. The conversation ends up being about engagement rates instead of conversion rates, and you lose sight of why you're marketing in the first place.
Moving from Vanity to Value
To really nail down how to track social media analytics for your store, you need to make a mental shift. It starts with asking the right business questions, not just pulling data.
So, instead of asking, "How many followers did we gain?" you should be asking, "How did our social channels impact our Customer Acquisition Cost (CAC) this month?"
This guide will walk you through building an analytics framework that's all about results. We're talking actionable insights, not just pretty numbers for a slide deck. We’ll connect every metric you track directly to a critical business outcome.
The ultimate goal of social media analytics for e-commerce is not to prove that social media is busy, but to prove that it is valuable. This means tying every post, campaign, and ad dollar back to tangible results like revenue, ROAS, and customer lifetime value.
Key Shifts for E-commerce Analytics
Here’s what this new, bottom-line-focused approach looks like:
- Prioritizing Revenue Metrics: We’ll zero in on KPIs that matter—Return on Ad Spend (ROAS), Conversion Rate, and Average Order Value (AOV) generated from your social channels.
- Navigating Platform Fragmentation: You'll learn how to pull together data from all over the place—Meta Ads, TikTok, and Google Analytics 4—to get a single, clear picture of what’s working.
- Adapting to Privacy Changes: We’ll cover how to keep your tracking accurate in a world of iOS updates and cookie restrictions, ensuring your data stays reliable.
By the end of this guide, you’ll have a practical playbook to turn your social media reporting from a list of superficial stats into a powerful tool for making smart decisions and driving real growth.
Connecting Social KPIs to Your Business Goals
Let's be honest, the foundation of great social media analytics isn't a flashy dashboard. It’s a rock-solid strategy. Too many e-commerce brands get bogged down tracking metrics that look good on paper but do absolutely nothing to move the needle on revenue.
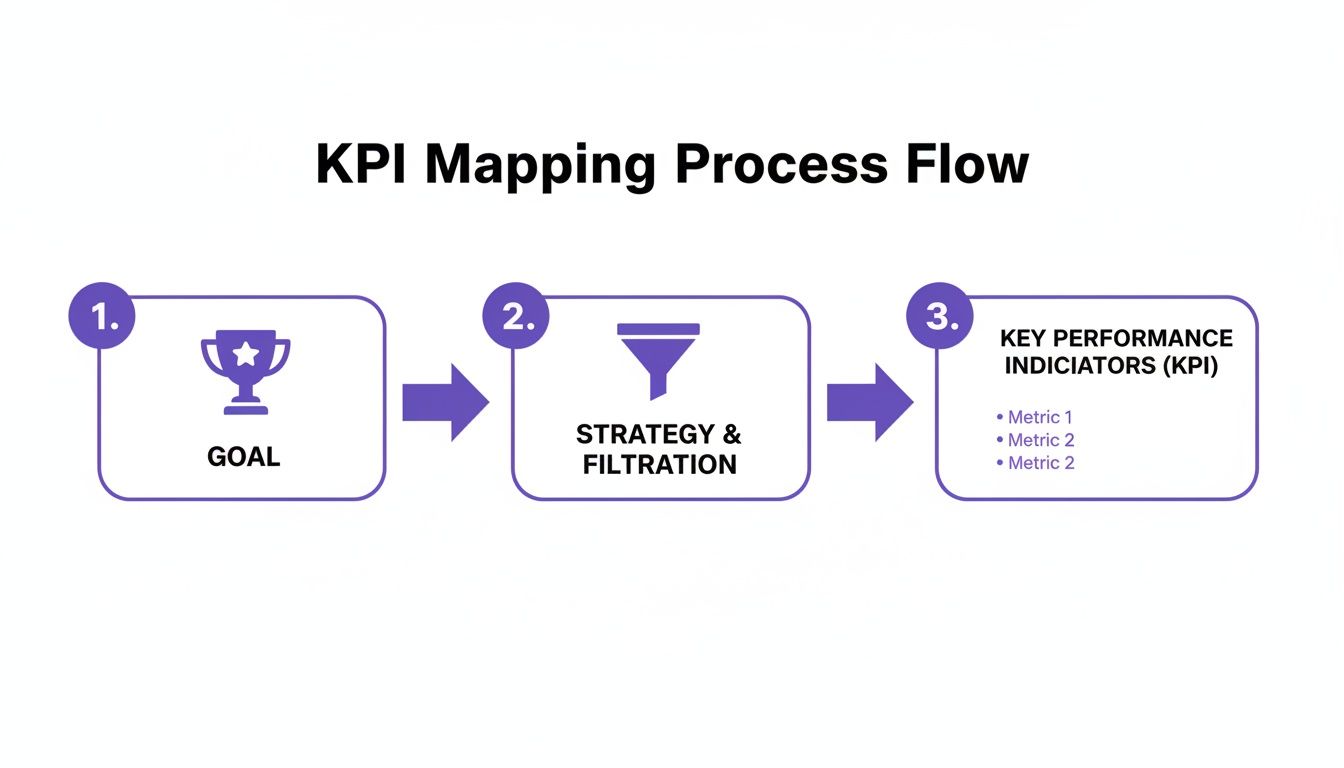
To get this right, you have to connect every single Key Performance Indicator (KPI) back to a real business outcome.
Imagine a DTC apparel brand sets a quarterly goal to increase online revenue by 15%. A vague social media goal like "grow our Instagram following" is pretty much useless here. It’s not connected to the money. The real work is breaking that big business objective down into specific, measurable social media goals that actually contribute to sales.
This means you need to map your KPIs to every stage of the customer journey. You have to know which metrics matter for getting new eyes on your brand, which ones push people to consider a purchase, and which ones finally turn a scroller into a paying customer.
Defining KPIs for Each Funnel Stage
For an e-commerce brand, the social media funnel is a direct path to the cash register. Each stage demands its own set of KPIs to tell you if you're on the right track.
Let's go back to our apparel brand. Here’s how they could approach it:
Top of Funnel (Awareness): The goal here is simple: get in front of new, relevant people. Instead of obsessing over follower count, they should be laser-focused on Reach and Video View Completion Rate. These numbers tell them if their content is actually grabbing the attention of potential customers, not just entertaining existing fans.
Middle of Funnel (Consideration): This is where people start seriously thinking about your products. The metrics that matter most are Click-Through Rate (CTR) on posts with product tags and Landing Page Views from social. A strong CTR is a clear signal that your creative is compelling enough to make someone take the next step.
Bottom of Funnel (Conversion): This is where the magic happens—and the money is made. The most important KPIs are Return on Ad Spend (ROAS), Conversion Rate, and Cost Per Acquisition (CPA). These metrics paint a clear, unfiltered picture of your profitability and how efficiently your campaigns are running.
The most powerful shift you can make in your analytics is moving from asking, "How did this post perform?" to "How did this post contribute to our business goals?" This changes the entire focus from content validation to business impact.
To make this crystal clear, you need a map that connects your high-level objectives to the nitty-gritty metrics you see in your dashboards every day.
Mapping E-commerce Goals to Social Media KPIs
This table shows how to link broad business goals with specific, trackable social media KPIs across the entire customer journey.
| Business Goal | Funnel Stage | Primary Social Media KPI | Example Platform Metric |
|---|---|---|---|
| Increase Brand Awareness | Top of Funnel (ToFu) | Reach | Instagram Post Impressions |
| Drive Product Discovery | Top of Funnel (ToFu) | Video Views | TikTok 3-Second Video Views |
| Boost Engagement | Middle of Funnel (MoFu) | Engagement Rate | Facebook Post Comments & Shares |
| Generate Qualified Leads | Middle of Funnel (MoFu) | Click-Through Rate (CTR) | Pinterest Outbound Clicks |
| Increase Online Sales | Bottom of Funnel (BoFu) | Conversion Rate | Shopify Purchases from Ads |
| Improve Ad Efficiency | Bottom of Funnel (BoFu) | Return on Ad Spend (ROAS) | Meta Ads Purchase ROAS |
| Reduce Acquisition Costs | Bottom of Funnel (BoFu) | Cost Per Acquisition (CPA) | Google Ads Cost per Conversion |
Having a map like this ensures that every metric you track has a purpose. It’s not just data for the sake of data; it’s a strategic tool.
From High-Level Goals to Actionable Metrics
Once you’ve defined your KPIs for each funnel stage, the next step is to get granular. You need to translate those KPIs into the specific metrics available on each social platform. This is where your strategy meets the real-world data you'll be pulling every day.
For example, a deep dive into analyzing TikTok account data to increase conversions can reveal exactly which videos are driving add-to-carts, not just views. That's the kind of detailed analysis that moves the business forward.
The global social media ad landscape is enormous, with spending projected to hit $276.7 billion in 2025. With that much money on the line, precise tracking isn't just a nice-to-have; it's essential.
And since mobile is expected to generate 83% of total social media ad spend by 2030, you absolutely have to understand which mobile-first channels—like YouTube with its 2.53 billion users or TikTok with 1.59 billion—are delivering the best return.
Ultimately, building a KPI map creates a direct line of sight from a single Instagram Reel view all the way up to your quarterly revenue goal. It transforms your analytics from a simple report into a strategic growth engine.
Setting Up Your Social Media Tracking Infrastructure
Now that you’ve mapped out your goals and KPIs, it’s time to roll up your sleeves and get into the tech. This is where we build the infrastructure that actually makes social media analytics work—the difference between guessing and knowing. We’re going to connect the dots from that initial click on a social ad all the way to a completed purchase.
Think of this as setting up the data plumbing for your store. If the pipes aren't connected right, you get leaks, and the data (your water) never makes it to the right destination. You end up with an incomplete picture, and that’s no way to run a business. We'll start with the foundational tools every e-commerce brand needs in its stack.
Getting Started with Client-Side Tracking Pixels
The first and most fundamental layer of your setup is client-side tracking. This whole process relies on small snippets of code you place on your website, commonly known as pixels. You’ve probably heard of the big ones: the Meta Pixel and the TikTok Pixel. These little bits of code are your on-site reporters, sending information back to the social platforms every time a visitor takes a meaningful action.
Here's a quick look at how you can break down a big goal into measurable KPIs, which is exactly what these pixels help you track.
For an e-commerce brand, a pixel is set up to track critical events all along the customer journey. We’re not just talking about simple page views here; we're tracking high-intent actions that show someone is getting closer to buying.
- ViewContent: This fires when someone lands on a product detail page. They're interested.
- AddToCart: This tells you they've taken the next step and added an item to their cart.
- InitiateCheckout: A huge buying signal. They’ve started the checkout process.
- Purchase: The final step. The pixel fires when an order is successfully placed.
Tracking these specific events gives platforms like Meta the data they need to find more people like your customers, which makes your ads way more effective.
Keeping Your Data Squeaky Clean with UTM Tagging
Pixels are fantastic for telling you what happened on your site, but they don't always tell you which specific social post or ad brought that person there. That’s where Urchin Tracking Modules, or UTM tags, come in. They are just simple text parameters you add to the end of your URLs to feed specific source information into tools like Google Analytics 4 (GA4).
A consistent UTM strategy is completely non-negotiable for a serious e-commerce brand. Without it, your attribution data becomes a tangled mess, and you’ll have no real confidence in where to put your ad dollars next.
A properly built UTM link contains a few key pieces that keep your traffic data organized.
utm_source: This identifies the platform, likefacebookortiktok.utm_medium: This is about the marketing channel, likecpcfor paid ads orsocialfor organic posts.utm_campaign: Give your campaign a clear name, likespring_sale_2025.utm_content: Use this to tell your ads apart. Thinkvideo_ad_1vs.blue_dress_image.utm_term: Originally for paid search keywords, but you can get creative and use it for other identifiers on social.
Do yourself a favor and get your team on the same page with a standardized naming convention from day one. A simple spreadsheet can be the difference between clean, reliable reports and total chaos.
Future-Proofing with Server-Side Tracking
In the last few years, client-side tracking has run into some major headwinds. Things like Apple's Intelligent Tracking Prevention (ITP) and the big iOS 14 privacy update can block or limit how well your pixels work. This leads to lost data. Suddenly, your Meta Pixel isn't catching every purchase, and your ROAS numbers start looking a lot worse than they actually are.
The answer to this is server-side tracking. Instead of the user's browser sending data directly to Meta or TikTok, your website's server sends it. It's a much more direct and reliable connection that isn't as easily disrupted by ad blockers or browser settings.
While the client-side pixel is still essential, server-side tracking works alongside it to fill in the data gaps that all these privacy changes have created.
The main tool for this is a Conversions API (CAPI), which platforms like Meta and TikTok now offer. You’ll probably need a developer to help get CAPI implemented, but the payoff is huge: more accurate conversion data and, as a result, better ad performance. It creates a much more resilient tracking system that doesn't live or die by the browser.
To really build out a robust tracking setup, you need the right software backing you up. You can check out some of the Top 10 Best Social Media Analytics Tools to see what might fit your brand's specific needs. By combining pixels, strict UTMs, and server-side APIs, you create a powerful, multi-layered system that delivers the accurate data you need to actually grow your store.
How to Unify and Centralize Your Social Data
So, you’ve got your tracking infrastructure up and running. The data is flowing in from all directions. This is great, but it's also where a lot of e-commerce teams get stuck.
You have data from Meta Ads, TikTok, and Google Analytics 4, but they all live in separate houses, each telling a slightly different version of the same story. If you really want to understand how to track social media analytics, the next move is to get all that data under one roof.
Fragmented data gives you fragmented insights. It's that simple. When you're constantly bouncing between different platform dashboards, it’s almost impossible to see the big picture. You end up wasting hours trying to figure out why the numbers don't match, and you miss the critical connections between your channels. The only real solution is to build a single source of truth.
Don't worry, this doesn't mean you need a massive, enterprise-level data stack from day one. Your approach here can, and should, grow with your business.
Choosing Your Centralization Method
The right way to centralize your social data really depends on your brand's size and complexity. The key is to build a system that works for you now, not to over-engineer a solution for a business you might be in five years.
For Emerging Brands: You’d be surprised how much you can accomplish with a well-organized Google Sheet. Tools like Zapier or native platform connectors can automatically pipe in key metrics—spend, clicks, conversions—from your ad accounts directly into a spreadsheet. For an early-stage brand, this is often the perfect way to get a high-level view without a big investment.
For Growing Brands: As you scale, you'll quickly outgrow those manual spreadsheets. When they start to feel clunky, it’s time to upgrade to a data visualization tool. Something like Looker Studio (what used to be Google Data Studio) is a fantastic next step. These tools have built-in connectors that pull data directly from GA4, Meta Ads, and your e-commerce platform, letting you build automated, interactive dashboards that refresh on their own.
For Large Teams: Once you hit a certain scale, the data volume demands a more robust solution. This is where a data warehouse like Google BigQuery or Snowflake comes into play. It acts as a central library for all your raw data, which you can then clean, transform, and feed into powerful business intelligence (BI) tools for some seriously deep analysis.
Mastering Social Attribution in GA4
For most e-commerce businesses, Google Analytics 4 is the cornerstone of their data strategy. The problem is, its out-of-the-box settings often don't give your social media efforts the credit they deserve. To get a true picture, you'll need to get your hands dirty in GA4’s attribution settings.
GA4's default data-driven attribution model is a good starting point, but you have to make sure your UTM-tagged social traffic is being filed correctly. I always recommend creating custom channel groupings to cleanly separate paid social from organic social. You can even break it down further by platform (e.g., Facebook_Paid, TikTok_Organic). This kind of clean data hygiene is absolutely essential for building reports that tell you which channels are actually driving sales.
Pro-Tip: You will always see data discrepancies between platforms like Meta Ads and GA4. It's normal, so don't panic. Meta reports on a view-through and click basis, while GA4 usually defaults to last-click attribution. The best practice is to pick one platform—typically GA4—as your official "source of truth" for conversion reporting. This keeps everyone on the same page and prevents you from getting stuck in analysis paralysis.
Tying It All Together
When you centralize your data, you stop guessing. It allows you to confidently answer the big, strategic questions like, "What was our total blended ROAS across all paid social channels last quarter?" without spending half a day wrestling with CSV files.
The numbers make it clear why this is so critical. There are an estimated 5.42 billion social media users worldwide. With 93% of marketers focusing on social media, the challenge of tracking performance across the average 6.83 social networks a person uses monthly is staggering. Centralization isn’t a "nice-to-have" anymore; it's a necessity for making any sense of it all. You can discover more insights about social media marketing trends to understand the full picture.
Ultimately, a unified data strategy transforms your analytics from a backward-looking report card into a forward-looking engine for growth. It gives you the clarity you need to allocate your budget, optimize your campaigns, and drive real results.
Turning Data into Action with Smart Dashboards
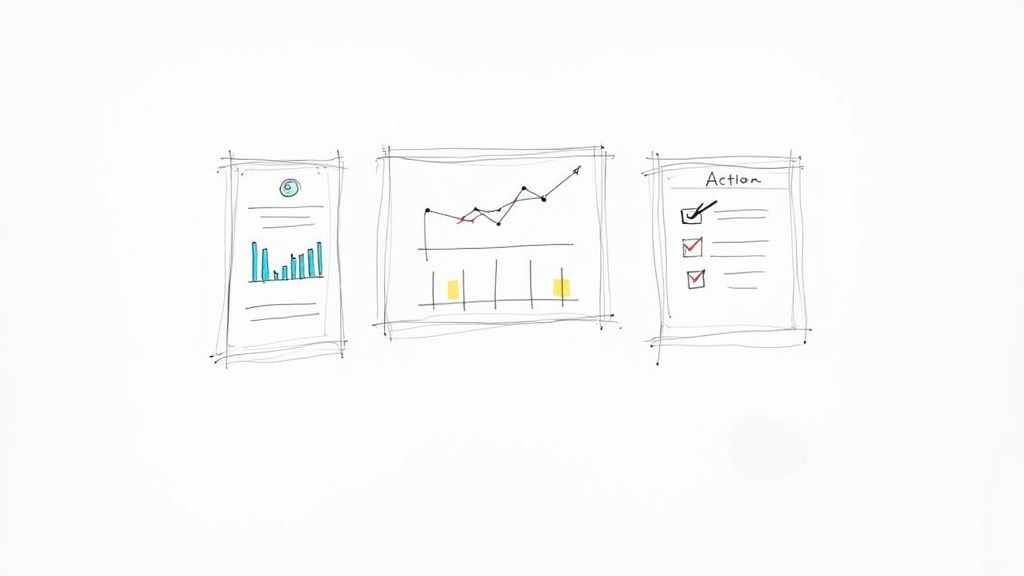
Having all your data in one place is a huge win, but let's be honest—it’s still just a pile of numbers until you make it mean something. To get real value, you have to turn that raw data into a story, a visual narrative that tells you what’s working and what’s not at a single glance. This is where a great dashboard comes into play.
A well-designed dashboard cuts through the noise. Instead of spending hours hunting through spreadsheets to find a trend, you can see it instantly in a chart or a graph. This is the final, and maybe most important, piece of the puzzle in learning how to track social media analytics: translating all that information into smart decisions that actually move the needle.
Choosing Your Dashboarding Tool
Before you start building, you need the right set of tools. There are tons of options out there, but for e-commerce teams, one platform consistently stands out for its power and price tag (or lack thereof).
My go-to recommendation is almost always Looker Studio (what used to be Google Data Studio). It's free, it plays nicely with Google Analytics 4 and Google Ads right out of the box, and it has connectors for pretty much every other tool you’re using—from Meta Ads and TikTok to your Shopify or BigCommerce store. This means you can pull everything into one clean, unified view.
The point of a dashboard isn't to cram every metric you track onto one screen. It's about highlighting the right metrics that answer your most critical business questions, so you can make smarter decisions, faster.
Designing Dashboards for Different Stakeholders
Here’s a hard-earned lesson: a single, one-size-fits-all dashboard just doesn't work. Your CEO wants a completely different snapshot of the business than your social media manager does. The secret to effective dashboards is tailoring them to the person who will be using them.
The Executive Dashboard (The 30,000-Foot View)
This one is all about the bottom line. It needs to be clean, simple, and answer the big-picture questions about growth and profitability in less than 30 seconds.
- What to show: Blended ROAS, overall revenue from social channels, Customer Acquisition Cost (CAC), and high-level month-over-month growth trends.
- Why it works: It gives leadership a quick, clear read on the financial impact of your social media efforts without getting bogged down in the nitty-gritty of individual campaigns.
The Channel Manager Dashboard (The In-the-Trenches View)
This is the daily command center for your performance marketing team. It has to be granular enough to help them make quick, tactical adjustments to campaigns.
- What to show: Campaign-level ROAS, Cost Per Click (CPC), Click-Through Rate (CTR), and Conversion Rate. Make sure it can be sliced and diced by ad set and creative.
- Why it works: It helps your team spot winning and losing ads, identify performance dips as they happen, and shift budgets to where they’ll have the most impact.
The Creative Team Dashboard (The Content Performance View)
Your content team needs to know what resonates. This dashboard focuses less on pure conversion metrics and more on the creative elements themselves.
- What to show: Video view completion rates, engagement rates for different creative formats (like UGC vs. a polished static image), and which hooks or opening lines are performing best.
- Why it works: It provides data-backed insights that fuel the next round of ad creatives and organic posts, taking the guesswork out of content strategy.
Reading a Dashboard to Find Opportunities
Okay, let’s put this into practice. Imagine you’re looking at your Channel Manager dashboard and see two campaigns.
Campaign A has a killer CTR of 3% but a dismal ROAS of 1.2x. At the same time, Campaign B has a more modest CTR of 1.5% but is crushing it with a 4.5x ROAS.
The dashboard is telling you a clear story. The ad in Campaign A is great at getting people to click (high CTR), but the interest dies somewhere after that. Maybe the landing page is confusing, or the ad promised something the page doesn't deliver.
On the other hand, Campaign B's creative might be less flashy, but it's attracting the right people—the ones who are actually ready to buy. Your next move is obvious: dig into the funnel for Campaign A to find the leak, and start scaling the budget for Campaign B. Without that dashboard, an insight like this could have stayed buried for weeks.
To give you a clearer picture of how this all fits together, here’s a simple framework you can use.
Sample Social Media Performance Dashboard Structure
This table provides a solid starting point for building out a comprehensive dashboard. It breaks down which metrics to group together to answer your most important strategic questions.
| Dashboard Section | Key Metrics | Primary Question Answered |
|---|---|---|
| Overall Performance Summary | Total Ad Spend, Revenue, Blended ROAS, CAC | Is our overall social media investment profitable? |
| Channel Performance Breakdown | ROAS by Platform (Meta, TikTok, Pinterest) | Which social channels are driving the best returns? |
| Top Performing Campaigns | Spend, Conversions, ROAS per Campaign | Which specific campaigns should we scale or learn from? |
| Creative Analysis | CTR, Video Completion Rate, Clicks by Ad Creative | What types of images and videos resonate most? |
| Funnel Conversion Rates | Add to Cart Rate, Initiate Checkout Rate | Where are we losing potential customers in the funnel? |
Building these dashboards is the last step in creating a powerful, closed-loop system for your marketing. You've set your goals, locked in your tracking, and brought your data together. Now, with a set of smart dashboards, you can finally visualize your performance, pull out those game-changing insights, and steer your brand toward real, sustainable growth.
Common Questions About Tracking Social Media Analytics
Even with a rock-solid plan, getting your analytics framework off the ground can feel a bit overwhelming. As you start hooking up tracking, wrangling data, and building dashboards, you’ll find the same questions tend to crop up. I've been there.
Let’s tackle some of the most common hurdles e-commerce teams hit when figuring out how to track their social media performance. Think of this as your quick-start FAQ for the real-world problems that can stop your progress cold.
What Are the Most Important Metrics for an E-commerce Store?
For an e-commerce brand, the metrics that truly matter are the ones tied directly to your bottom line. While things like follower count and engagement are great for building a community, they don't keep the lights on. When you're deciding what to track, you absolutely have to focus on the numbers that prove your social media efforts are actually making you money.
Your core four should always be:
- Return on Ad Spend (ROAS): This is your north star. It’s the simplest way to see how much revenue you're generating for every dollar you put into ads.
- Customer Acquisition Cost (CAC): This tells you exactly how much it costs, on average, to get a brand new paying customer through your social channels.
- Conversion Rate: What percentage of people who click your ad or social post actually end up buying something? That’s your conversion rate, and it’s a crucial measure of how effective your creative and landing pages are.
- Average Order Value (AOV): Are your social campaigns bringing in big spenders or bargain hunters? Tracking AOV from social referrals helps you understand the quality of the traffic you're driving.
These four KPIs give you a clean, finance-first look at your performance. This makes it a whole lot easier to justify your budget and prove your strategy is working when you talk to leadership.
Why Is My Data Different Between Facebook Ads and Google Analytics?
Ah, the classic question. This is probably the number one source of confusion I see, and the short answer is attribution models. It's completely normal for platforms like Meta and Google Analytics 4 (GA4) to show different numbers because they have different ways of giving credit for a sale.
Meta’s platform uses a much broader attribution window. It will often take credit for a conversion if someone just saw your ad and bought something later, even if they never clicked. GA4, on the other hand, usually leans on a last-click model, giving all the credit to the very last touchpoint before the purchase.
The trick isn't to waste hours trying to make the numbers match perfectly—they never will. Instead, you need to pick one platform to be your "source of truth" for reporting. For most e-commerce brands, this should be GA4. This creates consistency and ensures everyone on the team is making decisions from the same data set.
How Often Should I Report on Social Media Analytics?
Your reporting rhythm should change depending on who's looking at the report. A one-size-fits-all approach is a recipe for disaster—you’ll either drown your CEO in data they don't care about or leave your ad buyers without the real-time insights they need.
Here’s a simple way to think about it:
- Daily/Weekly Checks: The folks running your ads need to be in the accounts daily, or at least several times a week. They’re watching campaign-level metrics like CPA and ROAS to make quick tweaks and optimizations.
- Weekly/Bi-Weekly Team Syncs: For the broader marketing team, a weekly or bi-weekly report can focus on bigger trends. How are channels performing against each other? What creative is resonating? This helps guide the strategy for the next couple of weeks.
- Monthly/Quarterly Executive Updates: When you're reporting up to leadership, zoom way out. They want to see the high-level business impact. Show them blended ROAS, overall revenue growth driven by social, and how you’re tracking toward your big business goals.
How Can I Ensure My Tracking Is Accurate with Privacy Changes?
Welcome to the new normal. With privacy updates like Apple's iOS 14, relying only on the old-school tracking pixel just won't cut it anymore. To get a clear picture of what's working, you need to layer your approach.
First, you absolutely have to implement server-side tracking. For platforms like Meta and TikTok, this means setting up their Conversions API (CAPI). It creates a more durable connection between your website and the ad platform, one that isn't so easily disrupted by browser settings or ad blockers.
Second, get serious about building your first-party data. Use your social channels to push people to your email and SMS lists. These are audiences you own and can communicate with directly, without an algorithm getting in the way.
Finally, you have to get comfortable working with the ad platforms' modeled conversions. They use machine learning to estimate the conversions that can't be tracked directly. It’s not a perfect system, but it provides the directional data you need to keep your campaigns on track.
Ready to stop overpaying for essential e-commerce tools? EcomEfficiency bundles 50+ premium AI, SEO, and ad-spy tools into one simple subscription, saving you up to 99% on software costs. Cut your expenses and unlock the tools you need to grow at https://ecomefficiency.com.