Discover how to calculate return on ad spend and boost profitability
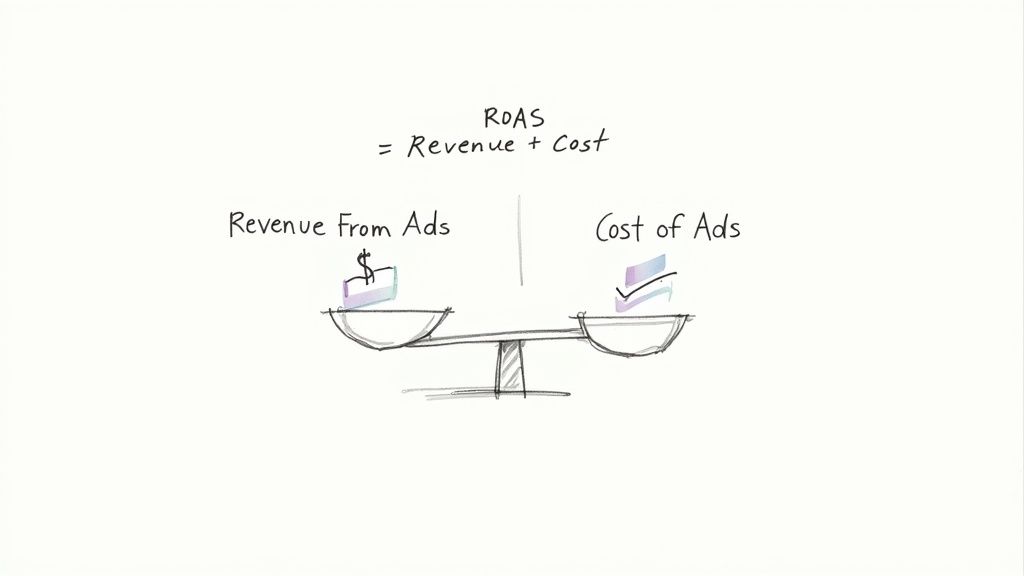
At its core, calculating your Return on Ad Spend is pretty simple. You take the total revenue your ads brought in and divide it by what you paid for those ads.
The goal is to scale without dubious shortcuts and without hurting your credibility.
Let’s say you spent $500 on a campaign and it generated $2,000 in sales. Your ROAS would be 4:1 (often shown as 400%). It's a straightforward way to see exactly what you're getting back for every dollar you put in.
Understanding What Return on Ad Spend Really Means
Before you can start fine-tuning your campaigns, you have to know what you’re actually measuring. Metrics like clicks and impressions are easy to find in your ad dashboards, but they don’t tell you if your ads are actually profitable. ROAS is the metric that connects your ad spend directly to your bank account.
Think of it as the clearest signal of your advertising efficiency. Knowing how to calculate ROAS helps you answer the one question that truly matters for any campaign: "Is this actually working?" It forces you to look past vanity metrics and focus on the financial health of your marketing.
Why Is This Metric So Important?
As digital ad spending took off, marketers desperately needed a way to prove their campaigns were generating real value and justify their budgets. ROAS became that universal language for performance. As a general rule of thumb, an average ROAS across many industries hovers between 200% to 400%, which means getting back $2 to $4 for every $1 spent. You can dig deeper into global ad spend trends to see how these benchmarks have shifted over time.
For e-commerce stores, especially those battling it out on platforms like Google Ads, a 400% (or 4:1) ROAS is often the gold standard. Hitting that number is a great sign that you have a healthy, profitable campaign.
ROAS isn't just a number; it's a compass for your marketing strategy. It tells you which campaigns are your cash cows, which ones need a tune-up, and which ones are just draining your budget.
Breaking Down the ROAS Formula
To make sure we're on the same page, let's get crystal clear on the two parts of the ROAS equation. Getting these inputs right is the foundation for everything else.
Here’s a quick look at the components you’ll need to pull.
ROAS Calculation At a Glance
| Component | Description | Example |
|---|---|---|
| Revenue from Ads | This is the total sales income directly tied to a specific ad campaign. It’s the top-line revenue before any other costs are factored in. | A Facebook ad campaign generated $10,000 in sales. |
| Cost of Ads | This is simply what you paid to run the campaign. It’s your direct spend on the ad platform itself. | The Facebook campaign cost $2,500 to run. |
With these two numbers, you have everything you need to find your ROAS and start making smarter decisions about your ad budget.
Getting Your Hands Dirty: How to Calculate ROAS
The theory is great, but the magic happens when you start plugging in your own numbers. Let's walk through a few real-world scenarios you’ll definitely encounter when digging into your ad accounts.
The most common starting point is figuring out the ROAS for a single campaign. This gives you a clean, focused look at its performance and helps you decide whether it's time to scale up, make some tweaks, or pull the plug.
Calculating for a Single Campaign
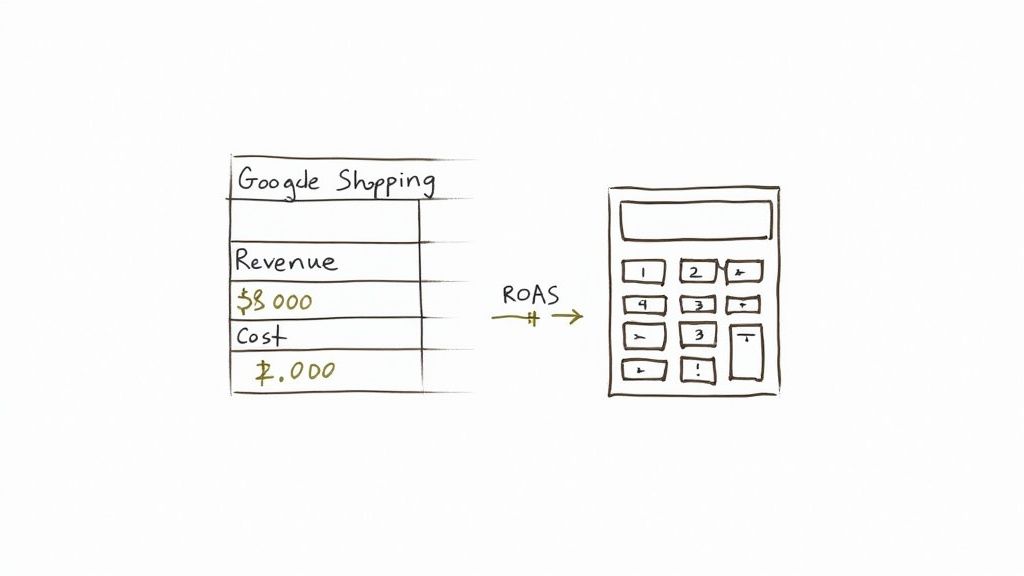
Let's imagine you’re running a Google Shopping campaign for your e-commerce store. You let it run for a month, and now it's time to check in. You open up your dashboard and see these two key numbers:
- Total Revenue Generated: $8,000
- Total Ad Spend (Cost): $2,000
The math is as simple as it gets:
$8,000 (Revenue) ÷ $2,000 (Cost) = 4
Your ROAS is 4. You'll also see this written as 4:1 or as a percentage, 400%. What this really means is that for every dollar you put into that campaign, you got four dollars back. For most e-commerce brands, that's a fantastic result that clears the common 4x benchmark.
To make these quick calculations even faster, especially when you're juggling multiple campaigns, a dedicated Return On Ad Spend Calculator can be a handy tool to have bookmarked.
Calculating a Blended ROAS
Rarely do brands stick to just one ad platform. You’re probably running ads on Facebook, maybe some on Instagram, and even dipping your toes into TikTok. When you're advertising across multiple channels, you need to calculate a blended ROAS to get a bird's-eye view of your overall marketing efficiency.
Let's say your monthly ad performance breaks down like this:
| Ad Platform | Ad Spend | Revenue Generated |
|---|---|---|
| Facebook Ads | $1,500 | $5,000 |
| Instagram Ads | $1,000 | $3,000 |
| TikTok Ads | $500 | $1,000 |
To get the blended figure, first, you need to add up your total spending and total revenue from all platforms.
- Total Ad Spend: $1,500 + $1,000 + $500 = $3,000
- Total Revenue: $5,000 + $3,000 + $1,000 = $9,000
Now, just run the formula with these total figures:
$9,000 (Total Revenue) ÷ $3,000 (Total Ad Spend) = 3
Your blended ROAS is 3:1 (or 300%). This is a crucial metric. While your Facebook (3.33:1) and Instagram (3:1) campaigns are doing well, the lower-performing TikTok campaign (2:1) is pulling your overall average down. This is exactly the kind of insight that informs high-level decisions about where to shift your budget next month.
Pro Tip: Always calculate both. A healthy blended ROAS can easily mask a money-pit campaign that’s dragging everything else down. You'll only catch it by looking at each channel individually.
A Simple Spreadsheet Formula
You don't need fancy software for this. A simple Google Sheet or Excel file is all it takes to build a powerful tracking dashboard.
If you put your revenue in cell A2 and your ad cost in cell B2, the formula is simply:
=A2/B2
That’s it. By setting this up for each campaign and for your overall totals, you can get a clear, immediate picture of your advertising performance and make smarter decisions, fast.
Moving from ROAS to True Profitability
It’s easy to get excited about a high ROAS figure lighting up your ad dashboard. But that number only tells you about revenue, not profit. This is a critical distinction, and it’s a trap many e-commerce brands fall into—chasing vanity metrics while their profit margins slowly erode.
The hard truth is that a 4:1 ROAS, often touted as a solid benchmark, could actually be losing you money if your product margins are thin. To make smart, sustainable decisions about where to put your ad dollars, you have to look past revenue and focus on actual profit. That starts with knowing your break-even point.
Finding Your Break-Even ROAS
Your break-even ROAS is the absolute minimum you need to make back from your ads just to cover your costs—the ad spend itself plus the cost of goods sold (COGS). Hit that number, and you haven't lost anything. Anything above it is pure profit.
Calculating it is more straightforward than you might think. First, you need your product's profit margin.
- Profit Margin Formula: (Retail Price - COGS) / Retail Price
With that number in hand, the formula for your break-even ROAS is simply:
1 / Profit Margin
Let's walk through an example. Say you're selling a product for $100. The total cost to source, produce, and get that product to the customer (your COGS) is $70.
- Your profit on each sale is $30.
- Your profit margin is 30% (calculated as $30 / $100).
Now, let's plug that into our break-even formula:
1 / 0.30 = 3.33
This tells you that you need a ROAS of at least 3.33:1 to break even on this specific product. If your campaign dashboard is showing a 3:1 ROAS, you're actually in the red on every sale, despite it looking like a positive return.
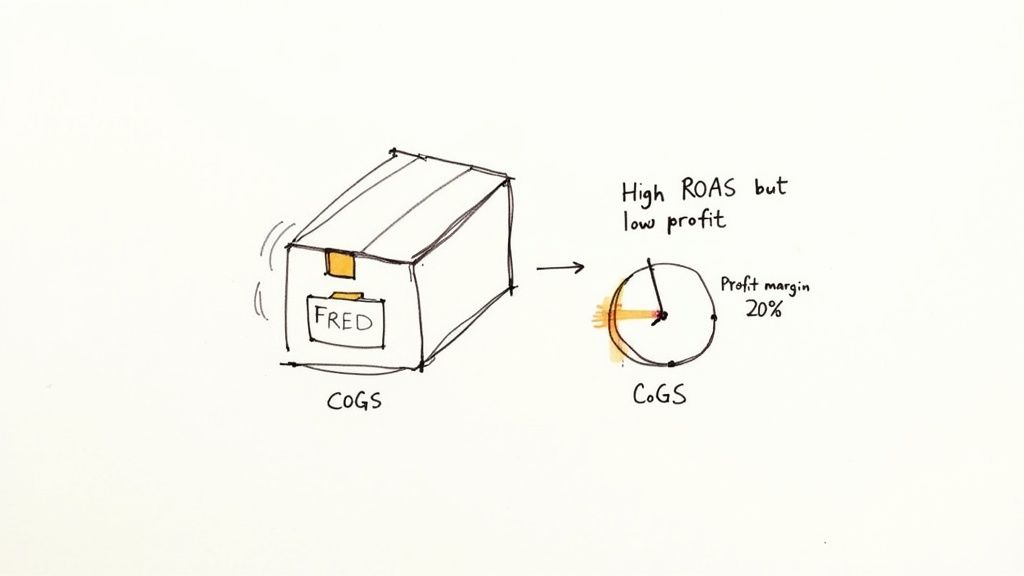
The Sobering Reality of Low Margins
Now, consider a more dangerous scenario. You're running ads for a different product, also priced at $100, but this one has a razor-thin profit margin of just 20%. That means your COGS are $80.
Let's calculate the break-even ROAS for this item:
1 / 0.20 = 5
Suddenly, that great-looking 4:1 ROAS your campaign is getting is actually a money-loser. This simple calculation cuts through the noise and reveals the true financial performance of your ads, which is more important than ever as digital advertising's rapid expansion since 2019 continues to drive up costs.
Knowing your break-even ROAS turns a simple advertising metric into a powerful business intelligence tool. It stops you from scaling campaigns that look good on the surface but are secretly draining your profitability.
Once you move past the basic ROAS formula, you gain a much clearer picture of your campaign's financial health. That clarity is what allows you to allocate your budget effectively and build an advertising strategy that’s genuinely profitable.
How Attribution and LTV Skew Your "Real" ROAS
The ROAS you see staring back at you from your ad platform dashboard? It’s not the whole story. In fact, it's just one version of the truth, shaped entirely by something called an attribution model.
Think of an attribution model as the rulebook your ad platform uses to decide which ad gets the credit for a sale. The model you choose—or the one the platform chooses for you—can make a campaign look like a hero or a zero.
Most ad platforms, like Google Ads and Meta Ads, lean heavily on last-click attribution. It’s exactly what it sounds like: the very last ad a customer clicked before buying gets 100% of the credit. Simple, right? But it's also incredibly misleading.
Imagine a customer sees your brand in an Instagram story, gets curious, and searches for you on Google a week later. They click a shopping ad and finally make a purchase. With last-click, that shopping ad gets all the glory, completely ignoring the vital role Instagram played in planting the seed.
Seeing the Full Customer Journey
This is why savvy marketers are moving toward multi-touch attribution models. These models are designed to distribute credit more fairly across the entire customer journey. A linear model, for instance, would give equal credit to every ad that customer interacted with along the way.
Why does this matter so much? A campaign that looks like a dud under a last-click model might actually be a top-of-funnel powerhouse, introducing scores of new people to your brand. If you only look at last-click data, you might kill a campaign that's secretly fueling your entire sales engine.
Choosing an attribution model isn't just a technical setting you tick in a box. It’s a strategic decision that defines how you value each stage of your marketing funnel. It directly influences which campaigns you scale and which ones you cut.
The Blind Spot: What Happens After the First Sale?
Even with the best attribution model in the world, a standard ROAS calculation has a massive blind spot: it only cares about the first purchase.
This is a huge issue for any business built on repeat customers. If you run a subscription box, sell consumables, or just have a loyal following, measuring the success of an ad based on a single transaction is like only reading the first chapter of a book. This is where Customer Lifetime Value (LTV) saves the day.
LTV is the total amount of money you expect to earn from a customer over their entire relationship with your brand. A campaign might have a weak initial ROAS, maybe just breaking even on that first order. But what if the customers from that campaign come back to buy again and again? Suddenly, that "break-even" campaign is one of your most profitable channels.
To get this bigger picture, you can calculate an LTV-adjusted ROAS.
- First, figure out the average LTV of customers who came from a specific campaign.
- Then, plug that LTV number into your ROAS formula instead of the initial revenue.
- The Formula: LTV-Adjusted ROAS = (Average LTV / Ad Spend)
This simple shift completely changes the game. It moves your focus from chasing short-term wins to building long-term, sustainable value. When you understand how LTV really impacts your ad spend, you can invest with confidence in campaigns that bring in high-value customers, even if their first purchase doesn’t deliver a mind-blowing ROAS.
Turning ROAS Data into Actionable Decisions
Figuring out your ROAS is just the first step. The real magic happens when you use that number to make smart, decisive moves with your ad budget. On its own, a ROAS number is just a data point without context. Is that 3:1 ROAS on your new campaign a win or a warning sign? The only way to know is to benchmark it.
Benchmarking is simply about comparing your results against established standards to see where you really stand. It helps you understand what's possible on different platforms. For example, a 200% ROAS (that's $2 back for every $1 spent) is considered average on Google Ads, but most e-commerce brands I work with are shooting for 400%. On Facebook, a 400% return is common, and I’ve seen retargeting campaigns hit 600% or more.
Digging Deeper: Segment Your Data for Real Insights
Your overall, blended ROAS gives you a nice 30,000-foot view of account health, but the most powerful insights are always buried deeper. To unearth them, you have to segment your performance. This means breaking down your ROAS by specific variables to see what's actually driving results and what’s just burning through your cash.
Start by slicing your data in these key ways:
- By Campaign: Which campaigns are your heavy hitters? Is one product launch leaving another in the dust?
- By Ad Group/Ad Set: Inside a campaign, which audience targeting is actually converting?
- By Creative: Are your video ads outperforming static images? Does one particular headline clearly resonate more than others?
- By Device: Are you getting a better return from mobile users or desktop shoppers? The answer might surprise you.
- By Audience: How do your prospecting campaigns (finding new customers) stack up against your retargeting efforts (bringing back old ones)?
Analyzing these segments is like going from a blurry, out-of-focus photo to a crystal-clear, high-resolution image. You'll start spotting patterns you couldn't see before—like a specific ad creative that kills it with mobile users or an audience segment that consistently delivers an incredible return.
This decision tree gives you a simple framework for what to do when your ROAS is low, especially when considering the long-term value of the customers you're acquiring.
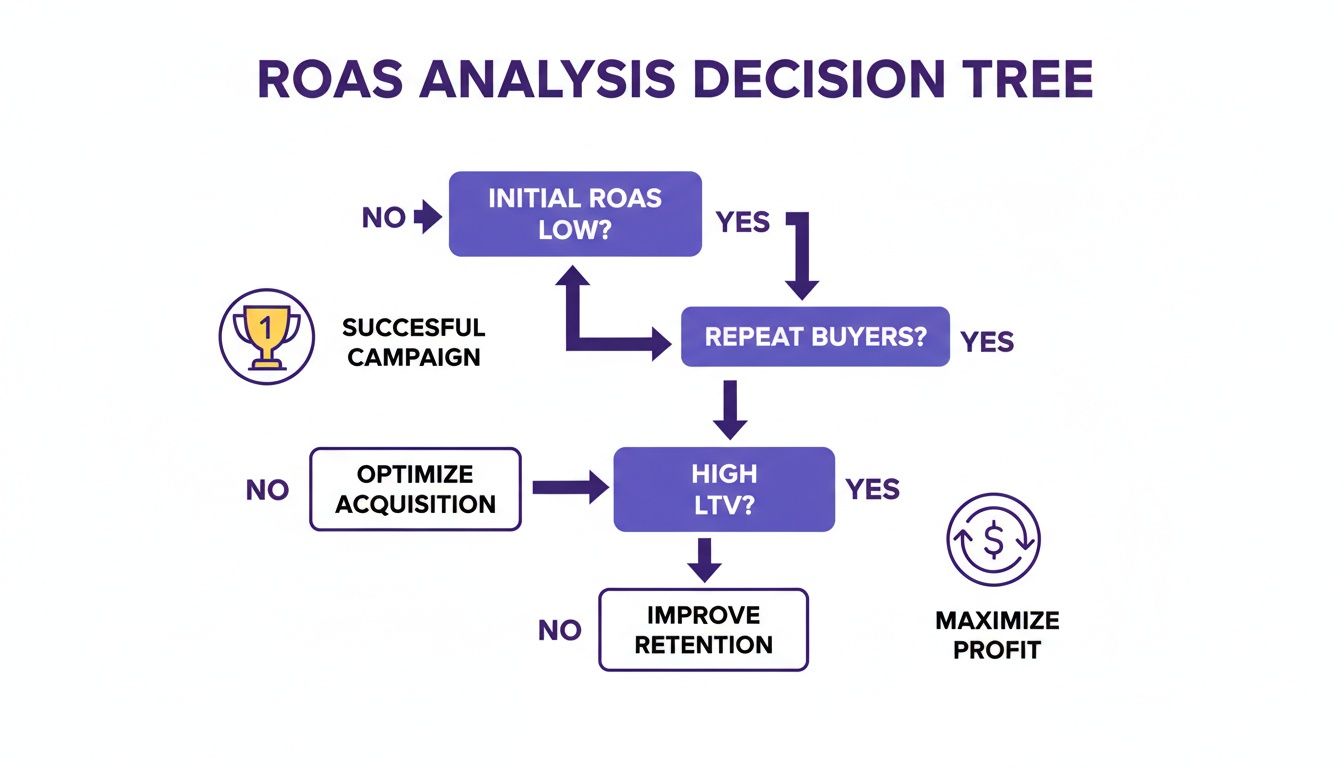
The key takeaway here? A low initial ROAS isn't automatically a failure. If that campaign is bringing in customers with a high lifetime value (LTV), it could still be a massive strategic win for your business.
Your Decision-Making Framework
Once you've got your segmented data, you can build a simple but incredibly effective framework for making decisions. This isn't about gut feelings; it's about listening to what the numbers are telling you.
When to Scale: If a campaign, ad set, or even a single ad is consistently crushing your target ROAS and is well above your break-even point, that's a green light. It's time to pour some more fuel on the fire. Just be sure to scale those winners gradually—I usually recommend increasing the budget by 15-20% every few days to avoid shocking the platform's algorithm.
When to Optimize: What if your ROAS is below your target but still profitable (meaning, it's above your break-even ROAS)? This is your cue to optimize, not panic. Dive into your segments and hunt for the weak spots. Often, the issue isn't the ad itself but the post-click experience. For instance, you can often improve landing page relevance to boost ROAS and turn a so-so campaign into a star performer.
When to Cut: Now for the tough one. If a campaign is consistently bleeding money and is way below your break-even ROAS—even after you've tried to optimize it—don't be afraid to pull the plug. Turn it off. Every single dollar you save from a failing ad is a dollar you can reinvest into a campaign that's actually working for you.
Answering Your Top ROAS Questions
Once you get the hang of the formulas, the real-world questions start popping up. It's one thing to know the math, but it's another to apply it confidently to your own marketing strategy. Let's dig into some of the most common questions I hear from fellow e-commerce store owners.
What Is a Good ROAS for E-commerce?
Ah, the million-dollar question. If you've been around the block, you've probably heard someone throw out 4:1 (or 400%) as the magic number. While that's often a solid benchmark, the real answer is: it depends entirely on your profit margins.
The most critical number you need to know is your break-even ROAS. This is the point where you're not making money, but you're not losing it either.
- If your profit margin is a healthy 50%, a 2:1 ROAS is your break-even point.
- But if you're working with a slimmer 25% margin, you'll need a 4:1 ROAS just to cover your costs.
Your true goal is to blow past your break-even number. A 4:1 ROAS is amazing for a business with high margins, but it's a fast track to going broke if your margins are thin.
How Is ROAS Different from ROI?
It's really easy to mix these two up, but they tell you very different stories about your business. I like to think of them as looking at your performance through different lenses—one's a magnifying glass, and the other is a telescope.
ROAS (Return on Ad Spend) is the magnifying glass. It's a hyper-specific metric that zeroes in on one thing: how much gross revenue you're generating for every dollar you spend on ads. It's all about campaign effectiveness.
ROI (Return on Investment) is the telescope. It gives you the big picture view. This is a much broader business metric that calculates the total profit from an investment after you've accounted for all the costs—ad spend, cost of goods, shipping, salaries, you name it.
ROAS tells you if your ads are bringing in money. ROI tells you if your business is keeping that money.
Why Does My Platform ROAS Not Match My Calculation?
This is a classic headache. You log into your Google Ads account and see a fantastic 5:1 ROAS, but your own spreadsheet is telling a different story at 3.5:1. What gives?
Nine times out of ten, the gap comes down to attribution models and conversion windows.
Your ad platform might be using a generous 30-day, data-driven attribution model that gives partial credit to multiple ad clicks over a month. Your internal calculation, on the other hand, might be based on a much stricter last-click model within a 7-day window. Neither is necessarily "wrong," they're just measuring different things.
On top of that, you have to contend with ad-blocking software, tracking pixel delays, and privacy updates that can skew the numbers. The key is to understand how your platforms are measuring success and then establish your own internal "source of truth" to make consistent, reliable decisions for your business.
Ready to stop guessing and start growing? EcomEfficiency bundles over 50 premium e-commerce tools for marketing, product research, and creative generation into one simple subscription. Cut your software costs by up to 99% and get the insights you need to boost your ROAS. Start your EcomEfficiency plan today.